The content reuse need include the original link: http://oliveryang.net
- 1. About
- 2. Big Picture
- 3. Tips
- 3.1 Perf
- 3.1.1 Perf cannot find external module symbols
- 3.1.2 Perf probe external module symbols
- 3.1.3 Show tracepoints in a kernel subsystem
- 3.1.4 Show kernel & module available probe points
- 3.1.5 How to add a dynamic kernel probe event via perf CLI?
- 3.1.6 “Failed to load kernel map” or “Failed to open debuginfo file” error messages
- 3.1.7 How to add a dynamic user space probe event via perf CLI?
- 3.1.8 Can’t show user process symbol correctly in call graph?
- 3.1.9 Sort call graph with better view?
- 3.2 SystemTap
- 3.2.1 How to run systemtap with customized kernel
- 3.2.2 Where can I find systemtap example scripts?
- 3.2.3 How to run pre-built systemtap module directly?
- 3.2.4 How to overwrite function return value?
- 3.2.5 How to get input arguments and local variables?
- 3.2.6 Address unwind data issue for a module
- 3.2.7 Error: probe overhead exceeded threshold
- 3.1 Perf
- 4. References
1. About
I used to be a Solaris DTrace fan. With helps of DTrace, people could easily understand how OS kernel working inside. After moving to Linux world, I found that Linux has a rich set of features related to dynamic tracing, like perf, ftrace, systemtap, kprobe, uprobe, tracepoint, eBPF…and so on.
At beginning, I did see the big gaps in Linux kernel dynamic tracing area. However, more and more new features got integrated into Linux recent years. Especially, with eBPF available in Linux 4.x kernel, I believe Linux dynamic tracing already performs better than Solaris DTrace.
Linux has already changed the OS world, whereas Solaris is going to die. Even today, the design and usage of DTrace are still elegant and outstanding, but nobody could prevent the trend of Open Source.
This article is about Linux trace tools introduction. Especially, the new dynamic trace tools which support turn on/off dynamic probes or trace events on the fly.
2. Big Picture
Today, there are many dynamic trace tools in Linux. Many people don’t have clear ideas or concepts about the positions of different Linux trace tools. Below Conceptual View of Linux trace tools could give you a high level overview about the positions of different Linux trace tools.
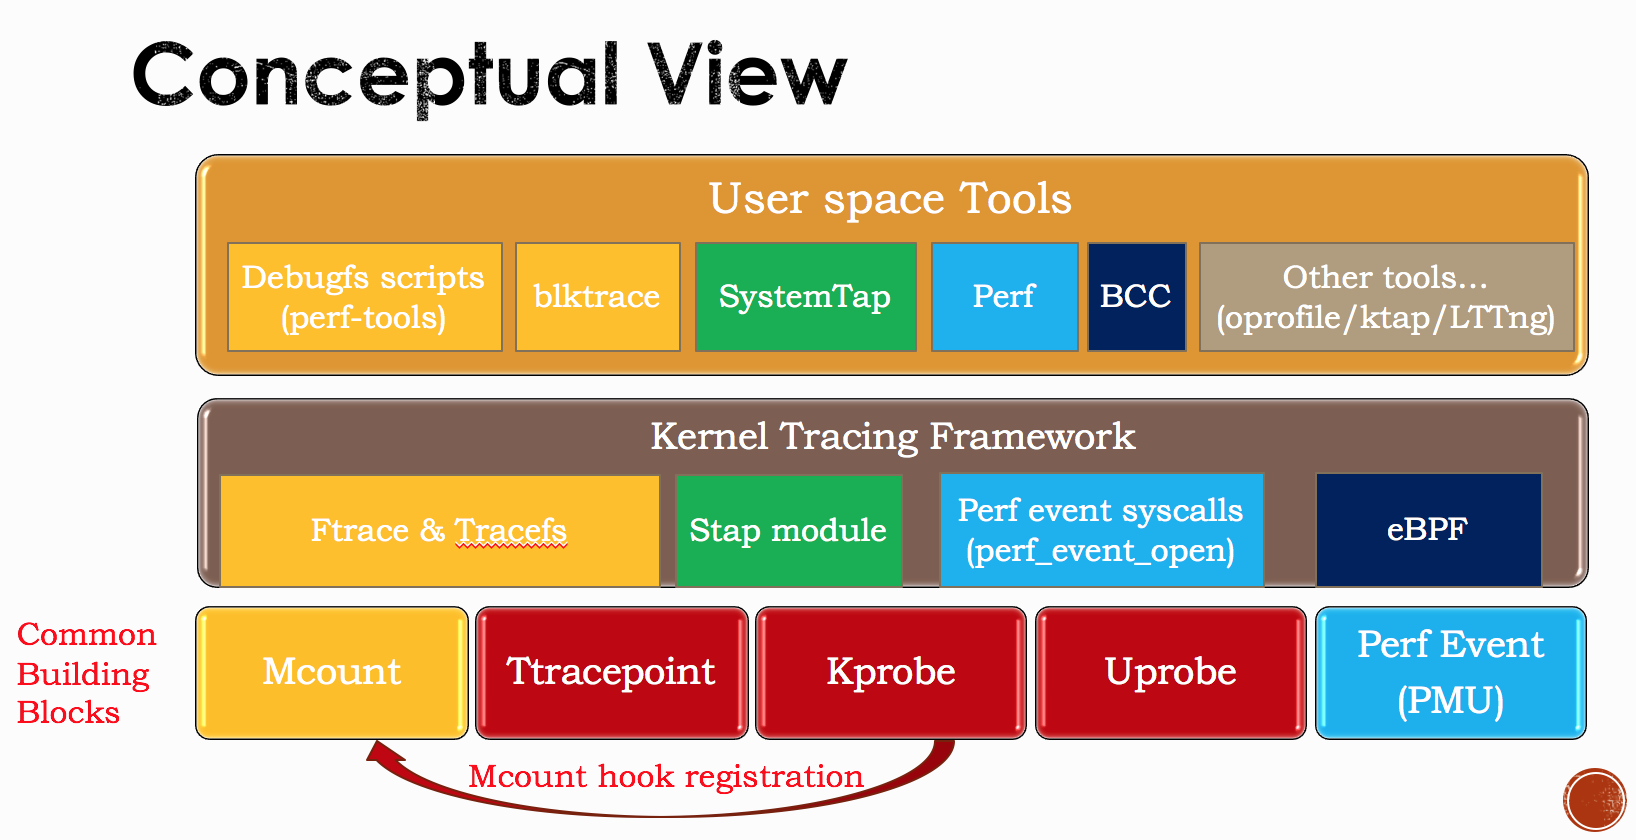
You may find that the underlying tools in above picture are the building blocks of other trace tools. Below mindmap could give you a big picture regarding to the classification of these building blocks.
- Trace Events
  - Software Events
    - Predefined
      - [Mcount](https://github.com/torvalds/linux/blob/master/Documentation/trace/ftrace.txt)
      - [Tracepoint](https://github.com/torvalds/linux/blob/master/Documentation/trace/tracepoints.txt)
    - Dynamic
      - [Kprobe](https://github.com/torvalds/linux/blob/master/Documentation/trace/kprobetrace.txt)
      - [Uprobe](https://github.com/torvalds/linux/blob/master/Documentation/trace/uprobetracer.txt)
  - Hardware Events
    - [Perf Events (PMU)](https://perf.wiki.kernel.org/index.php/Main_Page)
      - Core
      - Uncore
Linux trace tools give us a good opportunity to understand system behaviors deeply and quickly. In last month, I gave a presentation in community. In my talk, I shared my experiences on Linux perf tools usage. For more information, please download the slides - Using Linux Trace Tools - for diagnosis, analysis, learning and fun.
3. Tips
This section is just a collection of Linux perf tips instead of a well structured descriptions. The contents of the section might be changed per my daily updates.
3.1 Perf
3.1.1 Perf cannot find external module symbols
When running perf it finds the kernel symbols but it does not find external module symbols. The kernel module was written by me, and loaded by insmod command. How can I tell perf to find its symbols as well?
Below is the error messages what I got,
$ perf record -a -g sleep 1
[ perf record: Woken up 3 times to write data ]
[sampleblk] with build id 2584800c6deef34fb775fd4272b52cfe084104f1 not found, continuing without symbols
[ perf record: Captured and wrote 0.873 MB perf.data (4170 samples) ]
Here are the steps to fix the problem,
$ perf buildid-list
c7e7169b12d54db66ebe1c7f256e60dc3e9d4ee5 /lib/modules/4.6.0/build/vmlinux
2584800c6deef34fb775fd4272b52cfe084104f1 [sampleblk] >>> Problem?
b9d896cbaf62770a01594bd28aeba43d31aa440b /lib/modules/4.6.0/kernel/fs/ext4/ext4.ko

$ cp ./sampleblk.ko /lib/modules/4.6.0/kernel/drivers/block/
$ depmod -a
3.1.2 Perf probe external module symbols
List, add a kernel probe for a module, and record, report the profiling the results
$ perf probe -F -m /lib/modules/4.6.0/kernel/drivers/block/sampleblk.ko

$ perf probe -m /lib/modules/4.6.0/kernel/drivers/block/sampleblk.ko -a sampleblk_request

$ perf record -e probe:sampleblk_request -aRg sleep 1

$ perf report
3.1.3 Show tracepoints in a kernel subsystem
List all kernel block layer tracepoints,
$ sudo perf list subsys block:*
3.1.4 Show kernel & module available probe points
List all probe points in kernel,
$ perf probe -F
List all probe points in a module,
$ perf probe -F -m ext4
All of above probe points could be also used by ftrace and other kprobe based tools. By default, all kernel and module APIs could be listed as probe points.
3.1.5 How to add a dynamic kernel probe event via perf CLI?
In Linux kernel, dynamic kernel probe event is supported by kprobe. Perf CLI could be its front-end. First, get the what lines could be probed by perf,
$ sudo perf probe -L do_unlinkat | head -n2
<do_unlinkat@/lib/modules/4.6.0-rc3+/build/fs/namei.c:0>
0  static long do_unlinkat(int dfd, const char __user *pathname)
Second, query probable input arguments and local variable,
$ sudo perf probe -V do_unlinkat
Available variables at do_unlinkat
        @<do_unlinkat+0>
                char*   pathname
                int     dfd
                int     type
                struct inode*   delegated_inode
                struct path     path
                struct qstr     last
Last, add probe and start tracing,
$ perf probe --add 'do_unlinkat pathname:string'
$ sudo perf record -e probe:do_unlinkat –aR sleep 3600
$ sudo perf script
Besides tracing the function boundary, we could trace any line of source code or variables if kernel debug-info and source code is specified with -k/-s or installed to a right directory.
For example, using -L to browse the source code lines which could be traced. Here we just want to check line 32,
$ sudo sudo perf probe -L do_unlinkat | grep 32
     32  		inode = dentry->d_inode;
$ sudo sudo perf probe -V do_unlinkat:32
Available variables at do_unlinkat:32
        @<do_unlinkat+363>
                int     error
                int     type
                struct dentry*  dentry
                struct inode*   delegated_inode
                struct inode*   inode
                struct path     path
                struct qstr     last
                unsigned int    lookup_flags
At line 32, we could trace local variable dentry, then we add a new probe,
$ sudo perf probe -a 'do_unlinkat:32 dentry->d_iname:string'
Added new event:
  probe:do_unlinkat    (on do_unlinkat:32 with d_iname=dentry->d_iname:string)

You can now use it in all perf tools, such as:

	perf record -e probe:do_unlinkat -aR sleep 1
Run perf record with rm file command, we could print member of dentry struct (dentry->d_iname) easily,
$ sudo perf record -e probe:do_unlinkat -aR rm /tmp/test
[ perf record: Woken up 1 times to write data ]
[ perf record: Captured and wrote 0.161 MB perf.data (1 samples) ]
$ sudo perf script
              rm  2711 [000]  1710.484803: probe:do_unlinkat: (ffffffff8122855b) d_iname="test"
The syntax of kprobe event could be found from Documentation/trace/kprobetrace.txt.
3.1.6 “Failed to load kernel map” or “Failed to open debuginfo file” error messages
On my customized Linux kernel, I ran into above errors even, I specified the correct kernel debug-info binaries with -k option, why?
# perf probe -nv 'vfs_read:0 count' -k /vmlinux-ddr550797 -s ~/linux-3.2/
probe-definition(0): vfs_read:0 count -k /vmlinux-ddr550797 -s /root/linux-3.2/
symbol:vfs_read file:(null) line:0 offset:0 return:0 lazy:(null)
parsing arg: count into count
parsing arg: -k into -k
parsing arg: /vmlinux-ddr550797 into /vmlinux-ddr550797
parsing arg: -s into -s
parsing arg: /root/linux-3.2/ into /root/linux-3.2/
5 arguments
Looking at the vmlinux_path (6 entries long)
Failed to load kernel map.
Failed to find path of kernel module.
Failed to open debuginfo file.
  Error: Failed to add events. (-2)
Using strace could get the root causes,
# strace perf probe -nv 'vfs_read:0 count' -k /vmlinux-ddr550797 -s ~/linux-3.2/

[...snipped...]
write(2, "Looking at the vmlinux_path (6 e"..., 45Looking at the vmlinux_path (6 entries long)
) = 45
open("vmlinux", O_RDONLY)               = -1 ENOENT (No such file or directory)
open("/boot/vmlinux", O_RDONLY)         = -1 ENOENT (No such file or directory)
open("/boot/vmlinux-3.2.33-ddr552094", O_RDONLY) = -1 ENOENT (No such file or directory)
open("/lib/modules/3.2.33-ddr552094/build/vmlinux", O_RDONLY) = -1 ENOENT (No such file or directory)
open("/usr/lib/debug/lib/modules/3.2.33-ddr552094/vmlinux", O_RDONLY) = -1 ENOENT (No such file or directory)
write(2, "Failed to load kernel map.\n", 27Failed to load kernel map.
) = 27
write(2, "Failed to find path of kernel mo"..., 38Failed to find path of kernel module.
) = 38
write(2, "Failed to open debuginfo file.\n", 31Failed to open debuginfo file.
) = 31
write(2, "  Error: Failed to add events. ("..., 36  Error: Failed to add events. (-2)
) = 36
exit_group(254)                         = ?
+++ exited with 254 +++
Then we know that we could create a symbol link or make install kernel with debug-info to one of directories of above outputs.
# mkdir /lib/modules/3.2.33-ddr552094/build/
# ln -s /vmlinux-ddr552094 /lib/modules/3.2.33-ddr552094/build/vmlinux
With the workaround above, the perf command could work now.
3.1.7 How to add a dynamic user space probe event via perf CLI?
User space probe needs Uprobes support in both kernel and perf CLI.
First, you should make sure user space debuginfo package got installed. To trace glibc API,needs install glibc debuginfo packages. On RHEL, glibc debuginfo packages could be installed with below command,
$ sudo debuginfo-install glibc
Second, you could double check available dynamic probe points,
$ sudo perf probe -x /lib64/libc.so.6 -F | grep fopen64
fopen64
Third, list the input arguments and local variables,
[yango@localhost ~]$ sudo perf probe -x /lib64/libc.so.6 -L fopen64
<_IO_new_fopen@/usr/src/debug/glibc-2.17-c758a686/libio/iofopen.c:0>
      0  _IO_new_fopen (filename, mode)
              const char *filename;
              const char *mode;
      3  {
      4    return __fopen_internal (filename, mode, 1);
         }

         #ifdef _LIBC
Last, add the probe, record trace and display trace results,
$ sudo perf probe -x /lib64/libc.so.6 -V fopen64
Available variables at fopen64
        @<_IO_new_fopen+0>
                char*   filename
                char*   mode

$ sudo perf probe -x /lib64/libc.so.6 -a 'fopen64 filename:string'
$ sudo ./perf record -e probe_libc:fopen64 -aR sleep 60
$ sudo ./perf script
irqbalance   568 [001] 54683.806403: probe_libc:fopen64: (7f7289620a00) filename_string="/proc/interrupts"
irqbalance   568 [001] 54683.806753: probe_libc:fopen64: (7f7289620a00) filename_string="/proc/stat"
      perf 13914 [001] 54688.046240: probe_libc:fopen64: (7f47ed015a00) filename_string="/proc/self/status"
The syntax of kprobe event could be found from Documentation/trace/uprobetracer.txt
3.1.8 Can’t show user process symbol correctly in call graph?
Using perf record and perf script couldn’t show the call graph with correct symbol correctly (marked by unknown),
$ sudo perf record -a -g -e block:block_rq_insert sleep 10

$ sudo perf script
fio 71005 [000] 977641.575503: block:block_rq_insert: 253,1 W 0 () 3510 + 255 [fio]
                  5111e1 __elv_add_request (/lib/modules/4.6.0-rc3+/build/vmlinux)
                  518e64 blk_flush_plug_list (/lib/modules/4.6.0-rc3+/build/vmlinux)
                  51910b blk_queue_bio (/lib/modules/4.6.0-rc3+/build/vmlinux)
                  517453 generic_make_request (/lib/modules/4.6.0-rc3+/build/vmlinux)
                  517597 submit_bio (/lib/modules/4.6.0-rc3+/build/vmlinux)
                   107de ext4_io_submit ([ext4])
                    c6bc ext4_writepages ([ext4])
                  39cd3e do_writepages (/lib/modules/4.6.0-rc3+/build/vmlinux)
                  390b66 __filemap_fdatawrite_range (/lib/modules/4.6.0-rc3+/build/vmlinux)
                  3d5d96 sys_fadvise64 (/lib/modules/4.6.0-rc3+/build/vmlinux)
                  203c12 do_syscall_64 (/lib/modules/4.6.0-rc3+/build/vmlinux)
                  8bb721 return_from_SYSCALL_64 (/lib/modules/4.6.0-rc3+/build/vmlinux)
                   ebd4d posix_fadvise64 (/usr/lib64/libc-2.17.so)
                       0 [unknown] ([unknown])
By using dwarf method to collect call graph information, it could show the fio symbol in user space stack trace,
$ sudo perf record -a -g --call-graph dwarf -e block:block_rq_insert sleep 10

$ sudo perf script | head -n 20
fio 73790 [000] 1011438.379090: block:block_rq_insert: 253,1 W 0 () 3510 + 255 [fio]
              5111e1 __elv_add_request (/lib/modules/4.6.0-rc3+/build/vmlinux)
              518e64 blk_flush_plug_list (/lib/modules/4.6.0-rc3+/build/vmlinux)
              51910b blk_queue_bio (/lib/modules/4.6.0-rc3+/build/vmlinux)
              517453 generic_make_request (/lib/modules/4.6.0-rc3+/build/vmlinux)
              517597 submit_bio (/lib/modules/4.6.0-rc3+/build/vmlinux)
               107de ext4_io_submit ([ext4])
                c6bc ext4_writepages ([ext4])
              39cd3e do_writepages (/lib/modules/4.6.0-rc3+/build/vmlinux)
              390b66 __filemap_fdatawrite_range (/lib/modules/4.6.0-rc3+/build/vmlinux)
              3d5d96 sys_fadvise64 (/lib/modules/4.6.0-rc3+/build/vmlinux)
              203c12 do_syscall_64 (/lib/modules/4.6.0-rc3+/build/vmlinux)
              8bb721 return_from_SYSCALL_64 (/lib/modules/4.6.0-rc3+/build/vmlinux)
        7fd1e61d7d4d posix_fadvise64 (/usr/lib64/libc-2.17.so)
              4303b3 file_invalidate_cache (/usr/local/bin/fio)
              41a79b td_io_open_file (/usr/local/bin/fio)
              43f40d get_io_u (/usr/local/bin/fio)
              45ad89 thread_main (/usr/local/bin/fio)
              45cffc run_threads (/usr/local/bin/fio)
[...snipped...]
3.1.9 Sort call graph with better view?
While using perf record to understand kernel code path, one of issue is the perf report doesn’t give the proper view for code path learning purpose.
The -s parent option could sort output by parent functions of stack trace.
Below is an exmaple to learn memory allocation code path,
$sudo perf record -e kmem:mm_page_alloc -ag sleep 1
$sudo perf report --max-stack=6 --stdio -s parent
97.66%    97.66%  [other]
        |
        ---__alloc_pages_nodemask
           |
           |--54.31%-- alloc_pages_vma
           |          |
           |          |--76.58%-- handle_mm_fault
           |          |          |
           |          |          |--99.82%-- __do_page_fault
           |          |           --0.18%-- [...]
           |          |
           |          |--16.31%-- do_wp_page
           |          |          handle_mm_fault
           |          |
           |          |--7.08%-- __do_fault
           |          |          handle_mm_fault
           |           --0.03%-- [...]
           |
           |--45.49%-- alloc_pages_current
           |          |
           |          |--61.84%-- __get_free_pages
           |          |          |
           |          |          |--60.26%-- proc_pid_readlink
           |          |          |
           |          |          |--29.44%-- environ_read
           |          |          |
           |          |          |--4.29%-- get_zeroed_page
           |          |          |
           |          |          |--3.89%-- __tlb_remove_page
           |          |          |
           |          |          |--1.25%-- pgd_alloc
           |          |          |
           |          |          |--0.53%-- proc_pid_cmdline_read
           |          |           --0.33%-- [...]
           |          |
           |          |--23.63%-- pte_alloc_one
           |          |          |
           |          |          |--98.79%-- __pte_alloc
           |          |          |
           |          |           --1.21%-- copy_huge_pmd
           |          |
           |          |--10.04%-- __page_cache_alloc
           |          |          grab_cache_page_write_begin
           |          |
           |          |--3.71%-- __pmd_alloc
           |          |          |
           |          |          |--82.42%-- copy_page_range
           |          |          |
           |          |          |--13.19%-- handle_mm_fault
           |          |          |
           |          |           --4.40%-- move_page_tables
           |          |
           |          |--0.57%-- pipe_write
           |          |          do_sync_write
           |           --0.20%-- [...]
            --0.20%-- [...]

     2.01%     2.01%  sys_mincore
            |
            ---__alloc_pages_nodemask
               alloc_pages_current
               __get_free_pages
               sys_mincore
3.2 SystemTap
3.2.1 How to run systemtap with customized kernel
In short, we could rebuild systemtap and kernel to make it work together. Please refer to This article.
3.2.2 Where can I find systemtap example scripts?
For systemtap example scripts, there are two ways,
- Visit public example index page
-
Get it via local package installation
$ sudo yum install -y systemtap $ cd /usr/share/doc/systemtap-client-2.8/examples -
Access from systemtap source code repository
$ git clone http://sourceware.org/git/systemtap.git
$ cd ~/systemtap/testsuite/systemtap.examples
Reading example scripts is the best way to learn systemtap. SystemTap Beginners Guide is a good reference.
3.2.3 How to run pre-built systemtap module directly?
First, build the systemtap script by running stap -k option,
$ sudo stap -k iostats.stp
...[snipped]...
Keeping temporary directory "/tmp/stapKI1aZ3"
Then, find the module from temporary directory, and run it by staprun,
$ sudo staprun /tmp/stapKI1aZ3/stap_13235.ko
3.2.4 How to overwrite function return value?
Using the guru mode overwrites the kernel function return value. Below oneline script could make the function always return 1 to the caller,
$ sudo stap -g -e 'probe kernel.function("devmem_is_allowed").return { $return = 1 }'
3.2.5 How to get input arguments and local variables?
The -L option showed the source code information, input arguments, and local variables,
$ sudo stap -L 'kernel.function("do_unlinkat")'
kernel.function("do_unlinkat@fs/namei.c:3857") $dfd:int $pathname:char const* $path:struct path $last:struct qstr $type:int $delegated_inode:struct inode*
The -e option could be used in one liner command, and we could print 2nd argument of do_unlinkat by following way,
$ sudo stap -e 'probe kernel.function("do_unlinkat") { printf("%s \n", kernel_string($pathname))} '
3.2.6 Address unwind data issue for a module
Got following warning messages while running below SystemTap one line command,
$ sudo stap -e 'probe kernel.function("generic_make_request") { print_backtrace() }'
 0xffffffff81317350 : generic_make_request+0x0/0x1d0 [kernel]
 0xffffffff81317597 : submit_bio+0x77/0x150 [kernel]
 0xffffffffa02b5d6a [xfs]
 0xffffffffa02b7913 [xfs] (inexact)
 0xffffffffa02b7664 [xfs] (inexact)
 0xffffffffa02b7913 [xfs] (inexact)
 0xffffffffa02b86df [xfs] (inexact)
 0xffffffffa02b86df [xfs] (inexact)
 0xffffffffa02e4325 [xfs] (inexact)
 0xffffffffa02e40a0 [xfs] (inexact)
 0xffffffffa02e40a0 [xfs] (inexact)
 0xffffffff810a8cd8 : kthread+0xd8/0xf0 [kernel] (inexact)
 0xffffffff816bb882 : ret_from_fork+0x22/0x40 [kernel] (inexact)
 0xffffffff810a8c00 : kthread+0x0/0xf0 [kernel] (inexact)
...[snipped...]
WARNING: Missing unwind data for a module, rerun with 'stap -d xfs'
We could see there is no symbol for xfs module. The issue could be fixed by re-running below command,
$ sudo stap -d xfs -e 'probe kernel.function("generic_make_request") { print_backtrace() }'
Or using --all-modules option to add unwind/symbol data for all loaded kernel objects,
$ sudo stap --all-modules -e 'probe kernel.function("generic_make_request") { print_backtrace() }'
The --all-modules could increase the module size built by stap, -d should be better way to address the issue.
3.2.7 Error: probe overhead exceeded threshold
Systemtap will report error while a probe couldn’t return within a time threshold.
$ sudo ./kgdb.stp
ERROR: probe overhead exceeded threshold
WARNING: Number of errors: 1, skipped probes: 0
WARNING: /home/yango/systemtap-3.1-125278/bin/staprun exited with status: 1
Pass 5: run failed.  [man error::pass5]
There are two ways to bypass the problem,
sudo stap -g --suppress-time-limits ./kgdb.stp
Or,
sudo stap -DSTP_NO_OVERLOAD -v -g ./kgdb.stp